Outcome-Based Pricing: Reshaping Service Delivery Models
This blog focuses on the shifting trends of pricing and revenue models from the traditional fixed price and time & material (T & M) models to a business outcome-oriented model, resulting in long term gains for both – the service provider and the service buyer.
Background
Automation and digitization are changing the business world as we know it, offering tremendous potential and benefits to businesses and end consumers. Additionally, with increased exposure to newer technologies, the end consumer is becoming more and more price conscious. This is in turn putting pressure on service providers in the service supply chain to remain competitive and deliver maximum value with reduced prices.
Therefore, organizations are now looking at the expertise of their outsourcing providers to reduce costs or drive their topline with maximum return on investments. These changing industry dynamics are leading to a shift in revenue models and giving rise to adoption of a business outcome based model.
Need for Business Outcome Oriented Models
Historically, service providers have charged for services based on effort, e.g. time & material in hours/days or project effort (fixed price model). However, this model has also been increasingly criticized as there is no consideration given to the business outcome and the risk ownership is mostly with the service gainer/buyer. While in certain service scenarios like managed services, penalties are charged based on the defined SLAs; in most cases, these SLAs are usually defined based on predictable results and managed risks.
The actual shift in trends came when the volumes in the industry became volatile. While the service providers had very few levers to manage higher volumes, less than predicted volumes meant that the buyer ended up paying even when the resources were underutilized. To manage this volatility of volumes, buyers began to look for innovative models where risks would be shared, resulting in increased business value. This gave rise to a change from input-based pricing to output-based pricing, whereby the buyer only paid for the usage /output delivered.
In such a model, the volatility risk and management rests with the service provider and the buyer can focus on more strategic initiatives of his business, resulting in higher revenue productivity.
Comparison of Pricing Models
Let us draw a comparison and analyze the considerations for selecting the right pricing model:
| Pricing Model | Fixed cost | Time & Material (T & M) | Transaction based | Outcome based |
|---|---|---|---|---|
| Characteristics | Suitable when the scope is well defined and volumes are not fluctuating | Suitable when the scope is not well defined and requires a quick leverage of labor arbitrage | Suitable in case of well defined, stable requirements and service levels | Suitable in case of undefined scope/ fluctuating volumes but there is alignment with a business outcome like usage, increased sales, reduced costs, inventory etc. |
| Costs | Broadly fixed costs irrespective of the quality of delivery | Costs based on time and material, but output may not be aligned to business outcome | Costs in units, but output may not be aligned to business outcome | Costs as per pre-agreed business benefit delivered |
| Risk | Service provider’s risk on estimation, buyer’s risk on delivery and quality | Little risk to service provider, buyer’s risk on delivery, quality and outcome | Service provider’s risk on volume estimation, buyer’s risk on delivery and outcome | Mutual risk, more for service provider but including rewards |
| Challenges (Buyer) | Volume fluctuations, scope creeps, perceived as paying too high for low usage/volume periods, aligning output to business goals | Management overhead costs, return on investments | Scope/volume prediction, aligning output to business goals | Less risk for buyer, payouts linked to usage/business outcomes required |
| Challenges (Service Provider) | Risk on estimation | Negligible risk | Volume estimation, ramp up – ramp downs, seasonality | Estimation, payout structure: Risk for potentially zero revenue, if business outcomes not met |
Outcome-based Models – Key Considerations and Examples
As depicted in Table 1, outcome-based models are suitable when the outcomes can be directly linked to the business goals; business outcome benefits the end consumer and the service provider builds innovation to achieve the same.
The success of such models however lies heavily on measuring the outcomes. It is important to maintain a balance such that the buyer is able to define outcome appropriately which is measurable and acceptable to the service provider.
Figure 1 describes the typical outcome-based model and other innovative alternatives prevailing in the market.
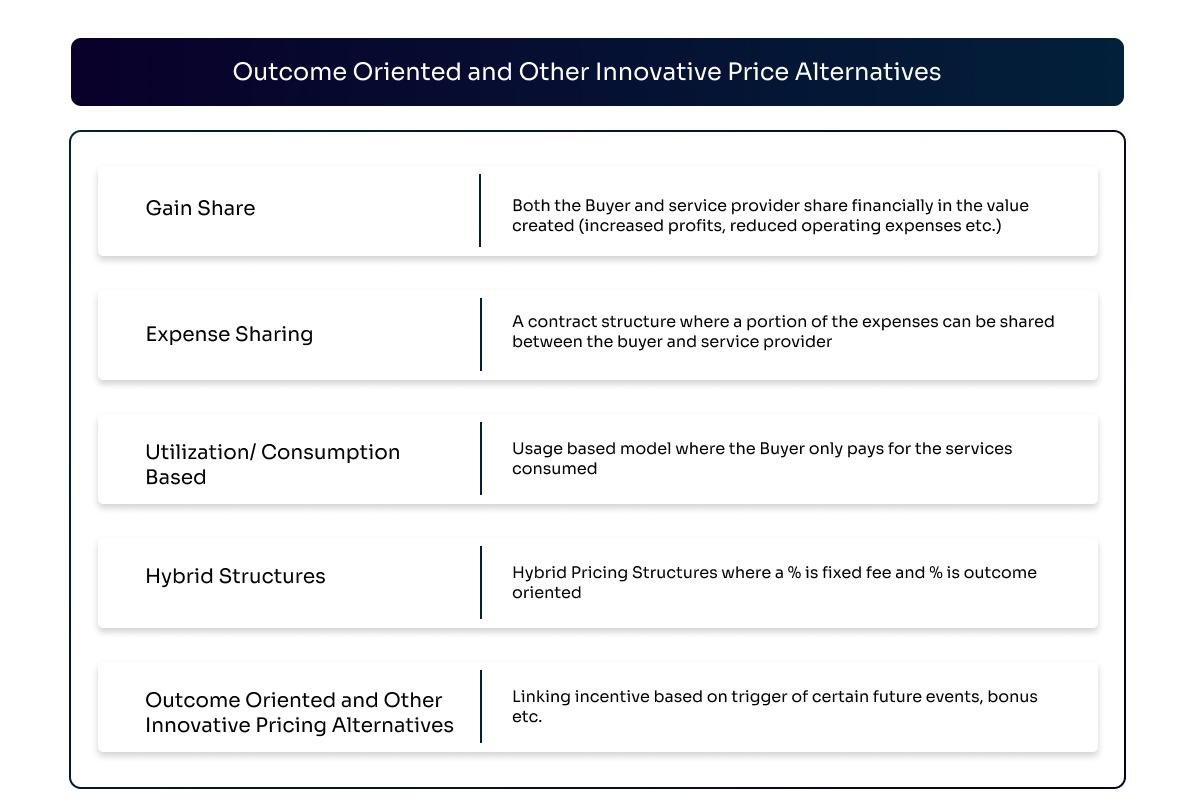
Although the outcome-based model became increasingly popular to begin with, it has not been very successful as very few service providers have the operational depth, skill or experience to put their skin in the game.
Let us analyze the models listed in Figure 1 above with suitable examples:
Gain Share
A contract structure where both the buyer and service provider share financially in the value created (increased profits, reduced operating expenses etc.) through a particular initiative is termed as a gain share model. However, besides sharing gains, risks are also equally shared.
Such pricing models require agreement from both parties on baseline of costs which can be attributed to revenue growth activities supported by the managed services partner and also establish a trusted partnering arrangement between the two parties. A typical example of such a model is the airport + concessionaire JV model where profit sharing is through dividends (due to visibility of books). This requires the airports’ willingness to share risk and upsides while concessionaires can focus on their day to day operations with participative management from the airport.
Another variant of this model prevailing in certain airports is a management contract where the concessionaire is owned by the airport and operations may be undertaken by an expert (concessionaire/third party) for a fee. This allows for control to be with the airport, yet the concessionaire is incentivized through share of revenue.
Let us take another example where a managed services provider is providing IT services to a contact center organization. One of the key metrics the contact center tracks is the costs, wherein a big cost component will be linked to the infrastructure and IT systems. In this scenario, the agreement with the service provider can be based on a cost optimization approach based on innovations and automations that lead to cost savings thereby rewarding the service provider with a portion of the gains. Such value typically comes with some investment, effort and is shared by the service provider.
These models are typically successful only where the service provider is willing to make the necessary investments and take the required risks as they may end up with potentially zero revenue, if business outcomes are not met. Investments may include people, process or technology intervention to design changes, implement them and then measure the results.
Expense Sharing
In certain cost heavy scenarios, models like expense share are also used where certain expenses can be borne by the buyer themselves. A typical example is an airport with limited OpEx. Such airports typically allow partners to sponsor the marketing/technology initiatives which need to be undertaken by the airport for their promotion in an expense share kind of a model.
Utilization/Consumption based
A business outcome may be derived from the end business goals and objectives. Let us take the example of a managed service provider providing IT support & infrastructure services to a contact center organization. The contact center typically uses a series of performance measures like seat utilization, connection times, average handling time etc. Managing ramp-ups/ramp-downs is a frequent task which the contact center has to manage for service transition and post stabilization subsequently. In this scenario, the buyer can contract with the service provider on a usage-based model or site as a service model where the buyer only pays for the services utilized. For instance, the buyer may pay only for telephony charges, seats based on consumption.
Hybrid Models
Since the outcome based and gain share models are based on a higher risk profile (cost, investment and result) and realization is uncertain, most contracts now comprise hybrid pricing structures rather than 100% gain share/outcome-based pricing which is divided between fixed fee and outcome oriented. The fixed fee typically covers the core expenses that the service providers are incurring and part of it is incremental.
It is worth noting that a single model is not suitable for all commercial businesses. The business needs to consider different factors while evaluating the right model for them – need for control, risk appetite, staffing, investment requirement & plans, need to scale up, their current operational expertise, and core competence.
Comparison between Fixed Price and Hybrid Outcome-based Model
Let us look at a sample illustration of comparison between a traditional fixed price and hybrid outcome-oriented structure and potential long-term benefits in outcome-oriented structure.
Table 2 depicts a traditional fixed price contract, wherein the service provider hedges their risk by charging an annual fixed price (considering a contract term of 10 years) to ensure a higher margin.
Table 2: Fixed price model (Illustrative) (Price in units)
| Cost Component | Year 1 | Year 2 | Year 3 | … | … | … | … | … | Year 10 |
|---|---|---|---|---|---|---|---|---|---|
| Fixed fee charged (X) | 16 | 16 | 16 | 16 | 16 | 16 | 16 | 16 | 16 |
| Expenses borne by the service provider (Y) | 12 | 12 | 13 | 14 | 14 | 14 | 13 | 13 | 13 |
| Margin (X-Y) | 4 | 4 | 3 | 2 | 2 | 2 | 3 | 3 | 3 |
| Total margin for service provider | 26 | ||||||||
| Total cost for buyer | 160 |
As seen in Table 2, the service provider’s expenses typically increase in the first 2-3 years after which they stabilize and further reduce based on productivity increase and cost saving initiatives taken over a period of time. In such a contract, considering the sample value, total margin for the service provider is 26 units and cost borne by the buyer for the 10-year term is 160 units.
Now let us draw a comparison with an outcome oriented hybrid model where fixed charges are reduced by 6 units based on the initial investments made by the service provider.
Table 3: Outcome oriented hybrid model (Illustrative)
| Cost Component | Year 1 | Year 2 | Year 3 | … | … | … | … | … | Year 10 |
|---|---|---|---|---|---|---|---|---|---|
| Fixed fee charged (X) | 10 | 10 | 10 | 10 | 10 | 10 | 10 | 10 | 10 |
| Utilization-based Fees (Z) | 1 | 2 | 3 | 5 | 6 | 6 | 7 | 7 | 8 |
| Gain share to service provider (% of benefits to buyer) (A) | 0 | 0 | 1 | 1 | 2 | 2 | 3 | 4 | 3 |
| Expenses borne by the service provider (Y) | 12 | 12 | 13 | 14 | 14 | 14 | 13 | 13 | 13 |
| Service provider margin (X + Z + A – Y) | -1 | 0 | 1 | 2 | 4 | 4 | 7 | 8 | 8 |
| Total cost for buyer (X+Z+A) | 11 | 12 | 14 | 16 | 16 | 18 | 20 | 21 | 21 |
| Total margin for service provider | 33 | ||||||||
| Total cost for buyer (X+Z+A) | 151 | ||||||||
| Total benefit/revenue to the buyer | > 160 (assuming gain share of 10% passed to the service provider) |
As illustrated in Table 3, a lesser fixed fee is charged along with a variable fee based on service utilization. Additionally, percentage gain share is also charged based on cost savings or revenue realized through various initiatives taken by the service provider. This is a measurable component taken as a percentage of revenue realized for the buyer.
While in the first year, the service provider margin may be in the negative, as the service provider will make the necessary investments by sharing the costs and giving a lower fixed price. From year 2 or 3 onwards, the gain share component will increase giving the required benefit to both the service provider and the buyer.
In the above model, the total margin for the service provider is 33 units and cost borne by the buyer for the 10 year term is just 151 units. In addition, the benefit provided to the buyer is higher than 160 units for the given tenure.
Based on the above comparison, it is evident that the outcome-oriented models have the potential to provide realized benefits to the buyer which in turn results in gains for the service provider. This is a win-win approach for both parties in the long term.
Conclusion
Outcome-based pricing is a model which should be looked at from a long-term gain perspective. It is not a model but a journey or a change program which needs to be carried by both the service provider and the buyer with a clear win-win mindset. The buyer needs to be transparent and share their vision and business strategy to enable the service provider to be a true business partner to it. The outcomes also need to be defined in clear agreement and need to be measurable with a high level of trust between the two parties.
While this model has great potential for both the buyer and the service provider, it should be based on mutual trust, collaboration, transparent governance, and communication. When approached in the right manner, it will give a competitive edge and result in long term gains for both parties in this extremely competitive business world.